Tropical Scan 
Check the NHC forecasts for the latest tropical information. Stay prepared and safe.
Atlantic + Gulf
Here are some of the most important maps and resources from the National Hurricane Center (NHC), located in Miami Florida. The NHC maintains a continuous watch on tropical cyclones and areas of disturbed weather within the North Atlantic and eastern North Pacific basins. It issues coastal tropical cyclone watches and warnings for the United States and its Caribbean territories and others.
NHC 5 Day Graphical Outlook Map

NHC 2 Day Graphical Outlook Map

NOAA 5 Day Rain Forecast Map
Atlantic Advisories
These feeds are from the NHC and provide official forecasts, watches and warnings. You can click on the title links to read the official sources.
- No tropical cyclones as of Fri, 26 Jul 2024 17:33:29 GMT
- 000 ABNT20 KNHC 261728 TWOAT Tropical Weather Outlook NWS National Hurricane Center Miami FL 200 PM EDT Fri Jul 26 2024 For the North Atlantic…Caribbean Sea and the Gulf of Mexico: Near the Lesser and Greater Antilles: An area of disturbed weather over the central tropical Atlantic Ocean is expected to interact with an approaching tropical wave during the next several days. Some development of this system will be possible while it approaches the Lesser Antilles during the early to middle part of next week and moves generally west-northwestward near the Greater Antilles toward the latter part of the week. […]
Eastern Pacific
The following cover storms along the west coast of Mexico and Baja California. These storms can sometimes move west to move towards Hawaii (see Central Pacific).
5 Day Outlook Map

2 Day Outlook Map

E. Pacific Advisories
These feeds are from the NHC and provide official forecasts, watches and warnings. You can click on the title links to read the official sources.
- 625 ABPZ20 KNHC 261721 TWOEP Tropical Weather Outlook NWS National Hurricane Center Miami FL 1100 AM PDT Fri Jul 26 2024 For the eastern North Pacific…east of 140 degrees west longitude: Active Systems: The National Hurricane Center is issuing advisories on Tropical Storm Bud, located several hundred miles west-southwest of the southern tip of the Baja California Peninsula. South of Southern Mexico: An area of low pressure could form by the middle of next week a few hundred miles south of the coast of southern Mexico. Some slow development is possible after that time as the system moves west-northwestward at […]
- Issued at 800 AM PDT Fri Jul 26 2024 966 WTPZ42 KNHC 261433 TCDEP2 Tropical Storm Bud Discussion Number 9 NWS National Hurricane Center Miami FL EP022024 800 AM PDT Fri Jul 26 2024 Bud has been devoid of any organized convection since about 03 UTC. The low-level circulation is exposed in latest GOES-18 satellite imagery. If the cyclone is unable to produce convection soon, it is in danger of degenerating to a post-tropical cyclone later today or tonight. Subjective and objective satellite intensity estimates range between 25-35 kt, the initial intensity is held at 35 kt for this advisory, […]
- Issued at 1500 UTC FRI JUL 26 2024 431 FOPZ12 KNHC 261433 PWSEP2 TROPICAL STORM BUD WIND SPEED PROBABILITIES NUMBER 9 NWS NATIONAL HURRICANE CENTER MIAMI FL EP022024 1500 UTC FRI JUL 26 2024 AT 1500Z THE CENTER OF TROPICAL STORM BUD WAS LOCATED NEAR LATITUDE 19.1 NORTH…LONGITUDE 119.6 WEST WITH MAXIMUM SUSTAINED WINDS NEAR 35 KTS…40 MPH…65 KM/H. Z INDICATES COORDINATED UNIVERSAL TIME (GREENWICH) PACIFIC DAYLIGHT TIME (PDT)…SUBTRACT 7 HOURS FROM Z TIME HAWAIIAN STANDARD TIME (HST)…SUBTRACT 10 HOURS FROM Z TIME WIND SPEED PROBABILITY TABLE FOR SPECIFIC LOCATIONS CHANCES OF SUSTAINED (1-MINUTE AVERAGE) WIND SPEEDS OF AT LEAST […]
- Issued at 1500 UTC FRI JUL 26 2024 814 WTPZ22 KNHC 261433 TCMEP2 TROPICAL STORM BUD FORECAST/ADVISORY NUMBER 9 NWS NATIONAL HURRICANE CENTER MIAMI FL EP022024 1500 UTC FRI JUL 26 2024 TROPICAL STORM CENTER LOCATED NEAR 19.1N 119.6W AT 26/1500Z POSITION ACCURATE WITHIN 30 NM PRESENT MOVEMENT TOWARD THE WEST OR 270 DEGREES AT 9 KT ESTIMATED MINIMUM CENTRAL PRESSURE 1007 MB MAX SUSTAINED WINDS 35 KT WITH GUSTS TO 45 KT. 34 KT……. 30NE 0SE 0SW 0NW. 12 FT SEAS.. 30NE 15SE 15SW 30NW. WINDS AND SEAS VARY GREATLY IN EACH QUADRANT. RADII IN NAUTICAL MILES ARE THE […]
- Issued at 800 AM PDT Fri Jul 26 2024 815 WTPZ32 KNHC 261433 TCPEP2 BULLETIN Tropical Storm Bud Advisory Number 9 NWS National Hurricane Center Miami FL EP022024 800 AM PDT Fri Jul 26 2024 …BUD STRUGGLING THIS MORNING… SUMMARY OF 800 AM PDT…1500 UTC…INFORMATION ———————————————- LOCATION…19.1N 119.6W ABOUT 680 MI…1090 KM WSW OF THE SOUTHERN TIP OF BAJA CALIFORNIA MAXIMUM SUSTAINED WINDS…40 MPH…65 KM/H PRESENT MOVEMENT…W OR 270 DEGREES AT 10 MPH…17 KM/H MINIMUM CENTRAL PRESSURE…1007 MB…29.74 INCHES WATCHES AND WARNINGS ——————– There are no coastal watches or warnings in effect. DISCUSSION AND OUTLOOK ———————- At 800 AM PDT […]
- …BUD STRUGGLING THIS MORNING… As of 8:00 AM PDT Fri Jul 26 the center of Bud was located near 19.1, -119.6 with movement W at 10 mph. The minimum central pressure was 1007 mb with maximum sustained winds of about 40 mph.
- 5-Day Uncertainty Track last updated Fri, 26 Jul 2024 14:34:50 GMT Wind Speed Probabilities last updated Fri, 26 Jul 2024 15:22:42 GMT
Central Pacific
The following maps are from the Central Pacific Hurricane Center (CPHC), co-located with the National Weather Service Forecast Office, in Honolulu Hawaii. According to the CPHC, it “issues tropical cyclone warnings, watches, advisories, discussions, and statements for tropical cyclones between 140 Degrees West Longitude to the International Dateline”. If you live in or travel to Hawaii, this is the area to watch.
5 Day Outlook Map

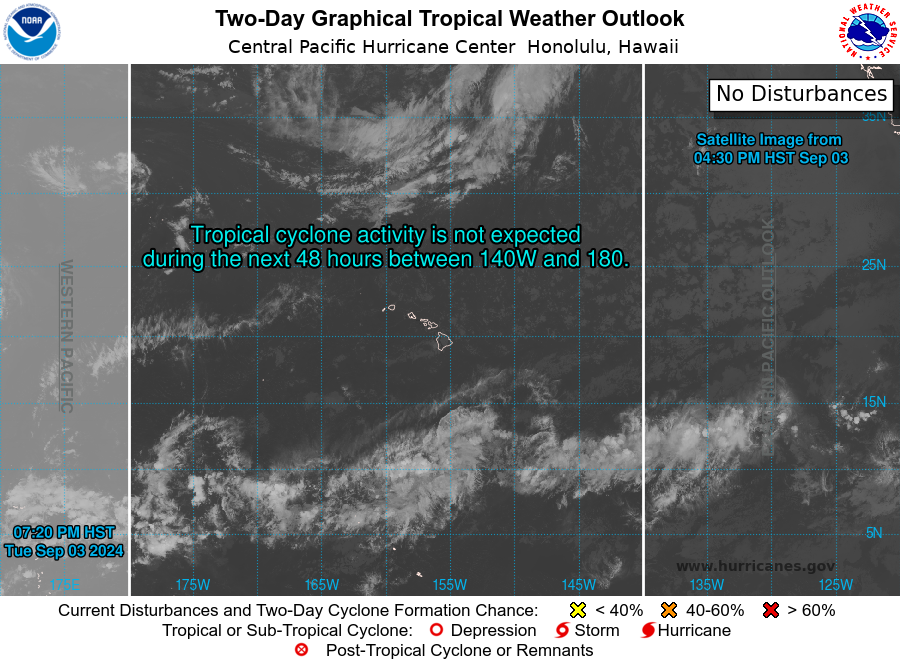
2 Day Outlook Map
C. Pacific Advisories
These feeds are from the CPHC/NHC and provide official forecasts, watches and warnings. You can click on the title links to read the official sources.
- No tropical cyclones as of Fri, 26 Jul 2024 17:33:29 GMT
- 000 ACPN50 PHFO 261729 TWOCP Tropical Weather Outlook NWS Central Pacific Hurricane Center Honolulu HI 800 AM HST Fri Jul 26 2024 For the central North Pacific…between 140W and 180W: No tropical cyclones are expected through the next 7 days. $$ Forecaster JT
2019 Hurricane Season
The hurricane season officially starts June 1st and ends on November 30th, but tropical storms can form at any time if conditions are right. Climate change is basically extending the season. However, about 95 percent of storms are produced during the two-and-a-half months of the season’s peak, from mid-August to late October.
2019 Storm Names
The National Hurricane Center issues lists of names for Atlantic and Eastern/Central Pacific storms. Below are the 2019 list, which I am redacting as they happen.
Atlantic Names
Andrea– formed May 20th and went to sea.-
Barry– formed TS on July 11, hit Louisiana as Hurricane. -
Chantal - Dorian
- Erin
- Fernand
- Gabrielle
- Humberto
- Imelda
- Jerry
- Karen
- Lorenzo
- Melissa
- Nestor
- Olga
- Pablo
- Rebekah
- Sebastien
- Tanya
- Van
- Wendy
Pacific Names
Alvin-
Barbara -
Cosme -
Dalila -
Erick -
Flossie -
Gil -
Henriette - Ivo
- Juliette
- Kiko
- Lorena
- Mario
- Narda
- Octave
- Priscilla
- Raymond
- Sonia
- Tico
- Velma
- Wallis
- Xina
- York
- Zelda
My FAV Weather Sites
I am listing the links that I visit the most often to get the latest tropical weather information and forecasts. You should watch your local weather forecasters as well to stay alert to specific threats to your location. The sites below are giving you the larger picture. Hurricanes and tropical storms are giant weather systems, but they can reach down to create very specific local damage.
National Hurricane Center – Official forecasts
Tropical Tidbits blog (and videos) – Levi Cowen explains the global and big picture weather patterns and fronts that steer these massive storms. This is actually very calming, as he doesn’t hype up what is happening. He posts to the blog and also has great videos explaining active tropical forecasts on his Tropical Tidbits YouTube channel as well.
Mike’s Weather Page – This website packs a tremendous amount of tropical weather maps, satellite imagery, and radar data. Mike is also from Florida, though we have not yet met. I follow his blog almost every day.
South Florida Water Management District model map – other high quality maps
Tropicals Tidbits GFS model – map is in a player to show potential paths of storms
Tropical Tidbits ECMWF model – map of this top European model also in a player
NASA Hurricane & Typhoon Blog – A scientific spin on the latest storms. No Hype. Often has the latest in remote sensing.
[ycd_countdown id=”388″][/ycd_countdown]
Your Safety is #1
When you ask “How do I prepare for Hurricane _______?” or “What do I do to prepare for Tropical Storm _______?”, we hope to help you by providing educational and information resources. Your safety is of paramount importance, so please always consult with official, expert forecasts and follow all your local warning, watches, and guidance.